Executive Summary
Georgia implemented automatic voter registration (AVR) in September 2016 as part of a broader effort to make its voter registration process more efficient, convenient, and modern. AVR is generally defined as a system that registers eligible citizens to vote by automatically and electronically transferring information necessary for registration from designated government agencies to election officials so that unless an individual withholds permission for the agency to do so, that person is registered to vote. AVR also updates existing voter registration information. Georgia operates AVR through its Department of Driver Services (DDS).
This report analyzes AVR’s impact in Georgia by studying trends in voter registration and turnout before and after its implementation. It draws from several data sources: records of all voter registrations in the state from 2014 to 2022 as provided by the Office of the Georgia Secretary of State, additional voter registration statistics published by the secretary’s office and U.S. Election Assistance Commission, population estimates from the U.S. Census Bureau, and voting eligible population estimates from the U.S. Elections Project. The analysis reveals that in the years since AVR’s implementation, the proportion of eligible Georgians who are registered to vote has increased substantially; the voter list has become more accurate and representative of the state’s population; and DDS has become a major source of voter registrations in the state, consistently registering new voters and updating existing registrations at a higher rate than other registration sources.
Key findings:
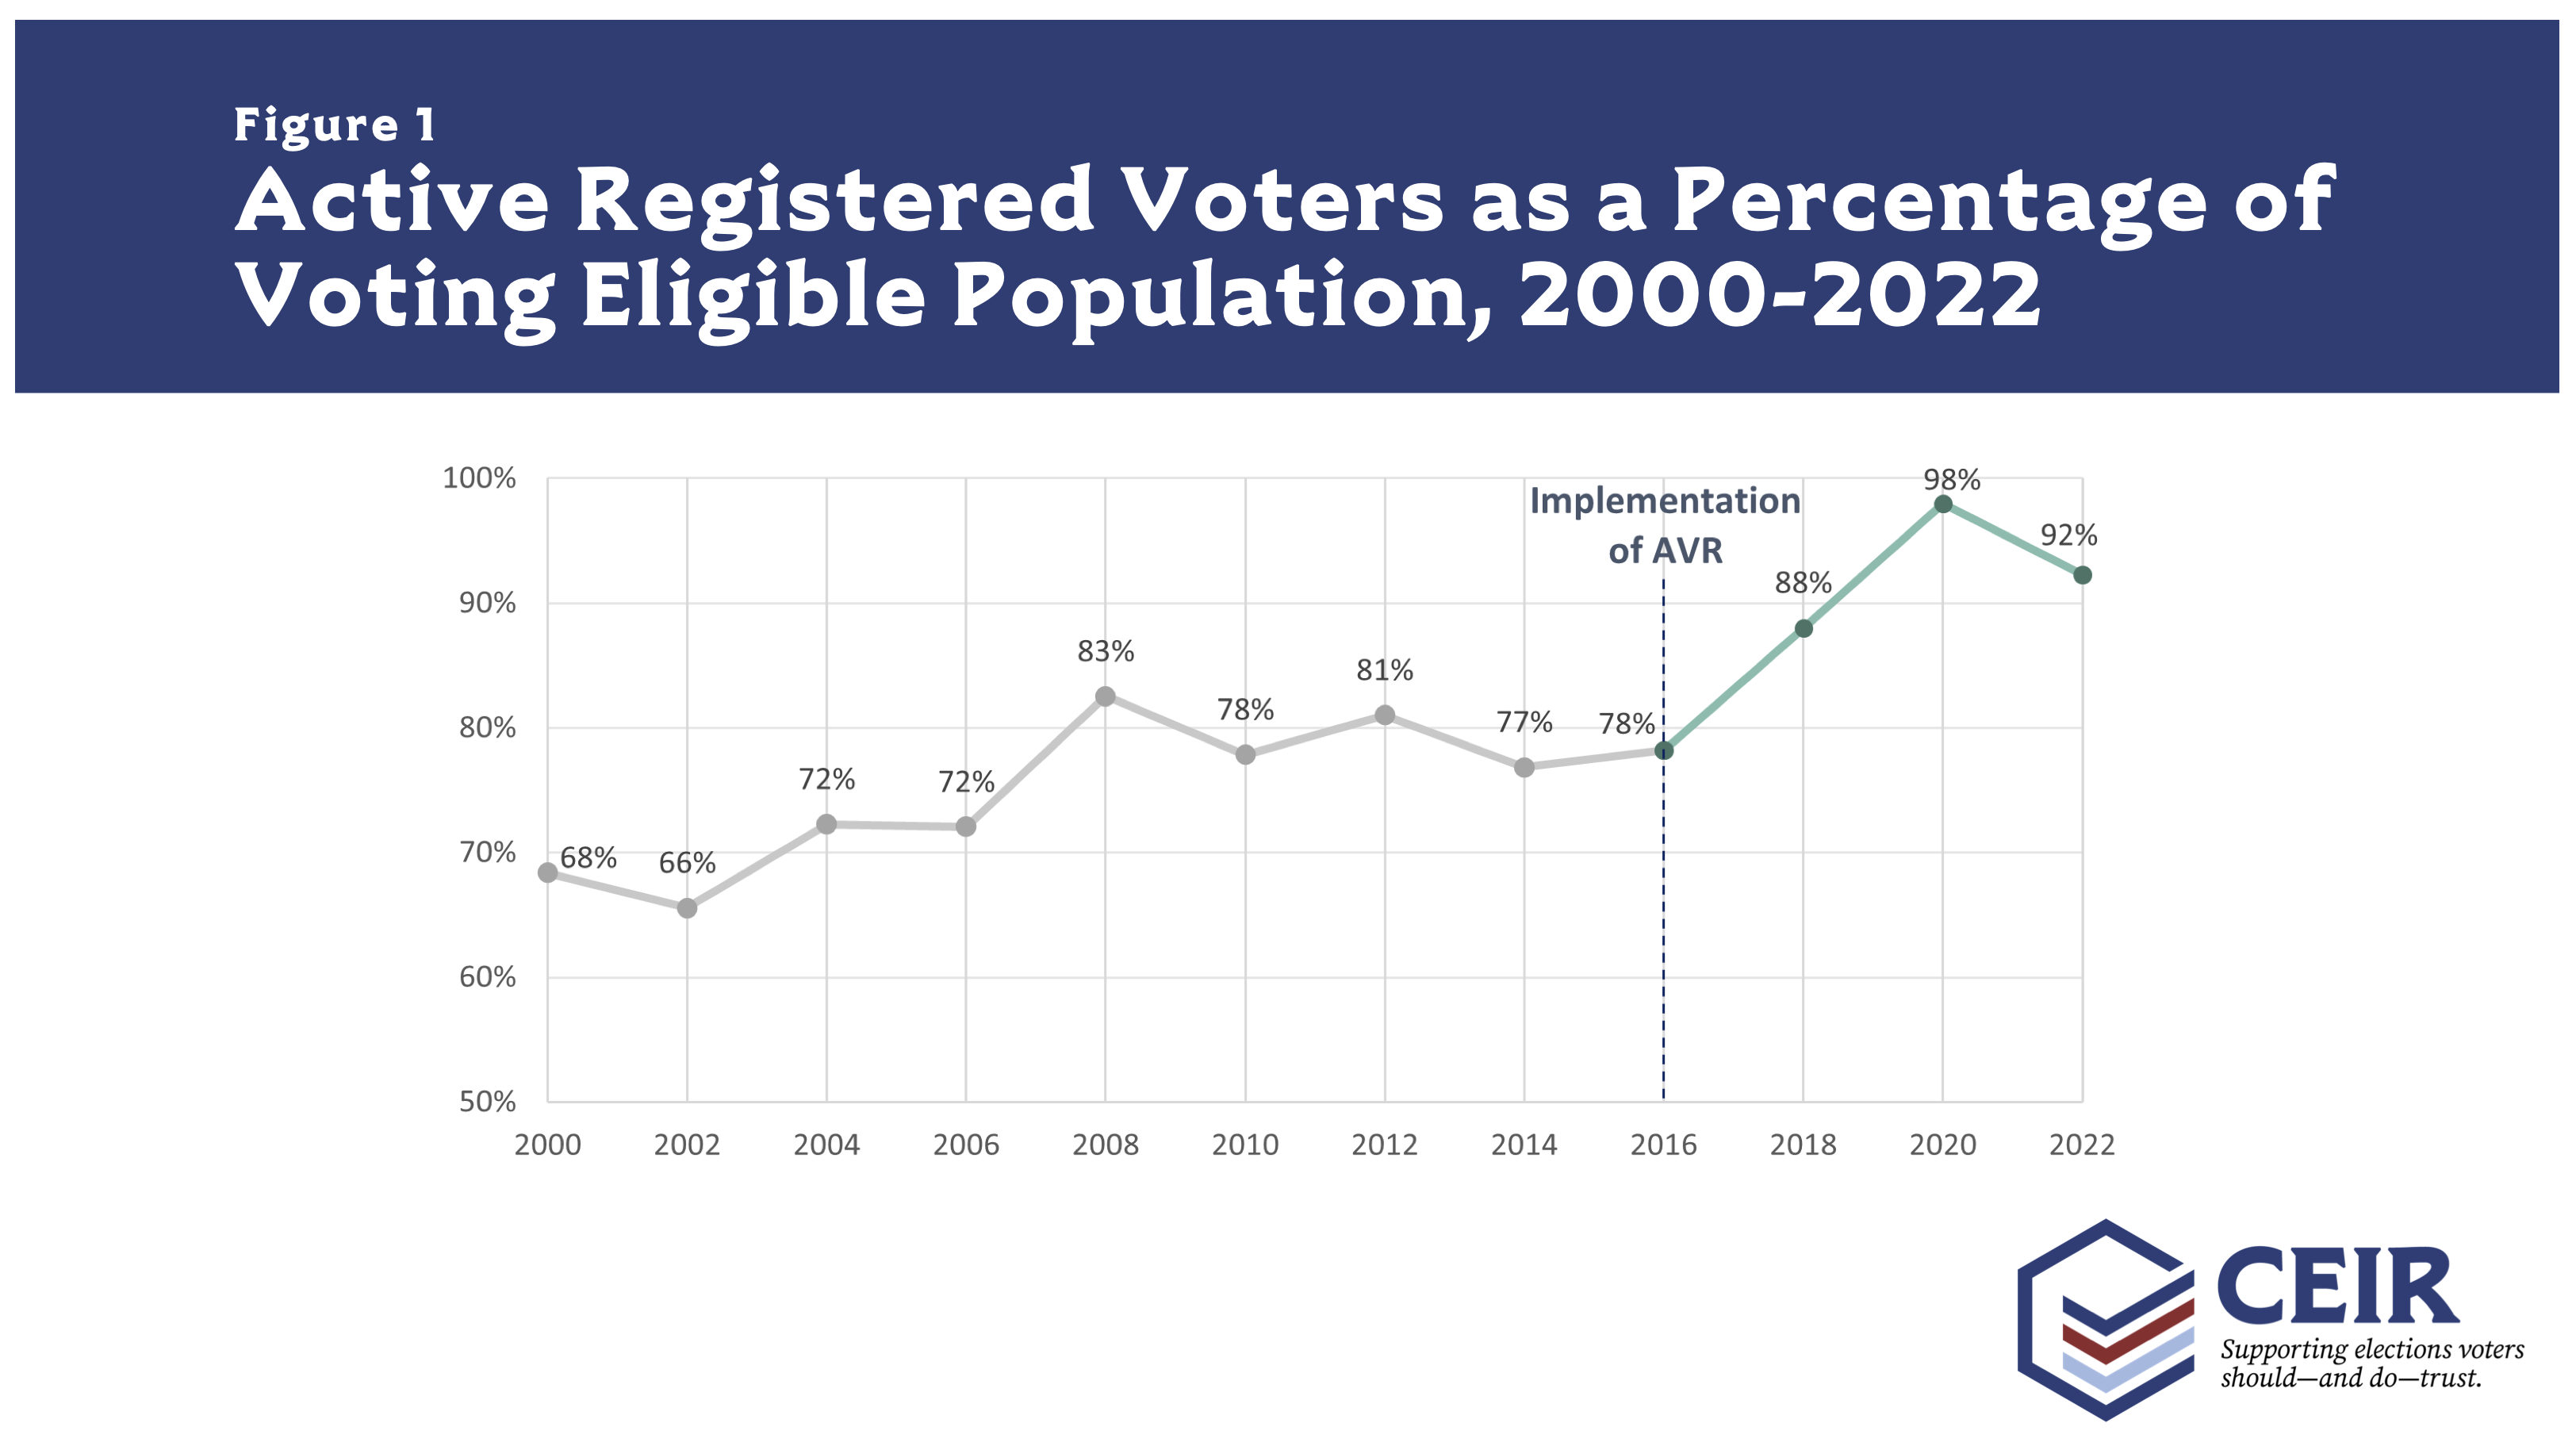
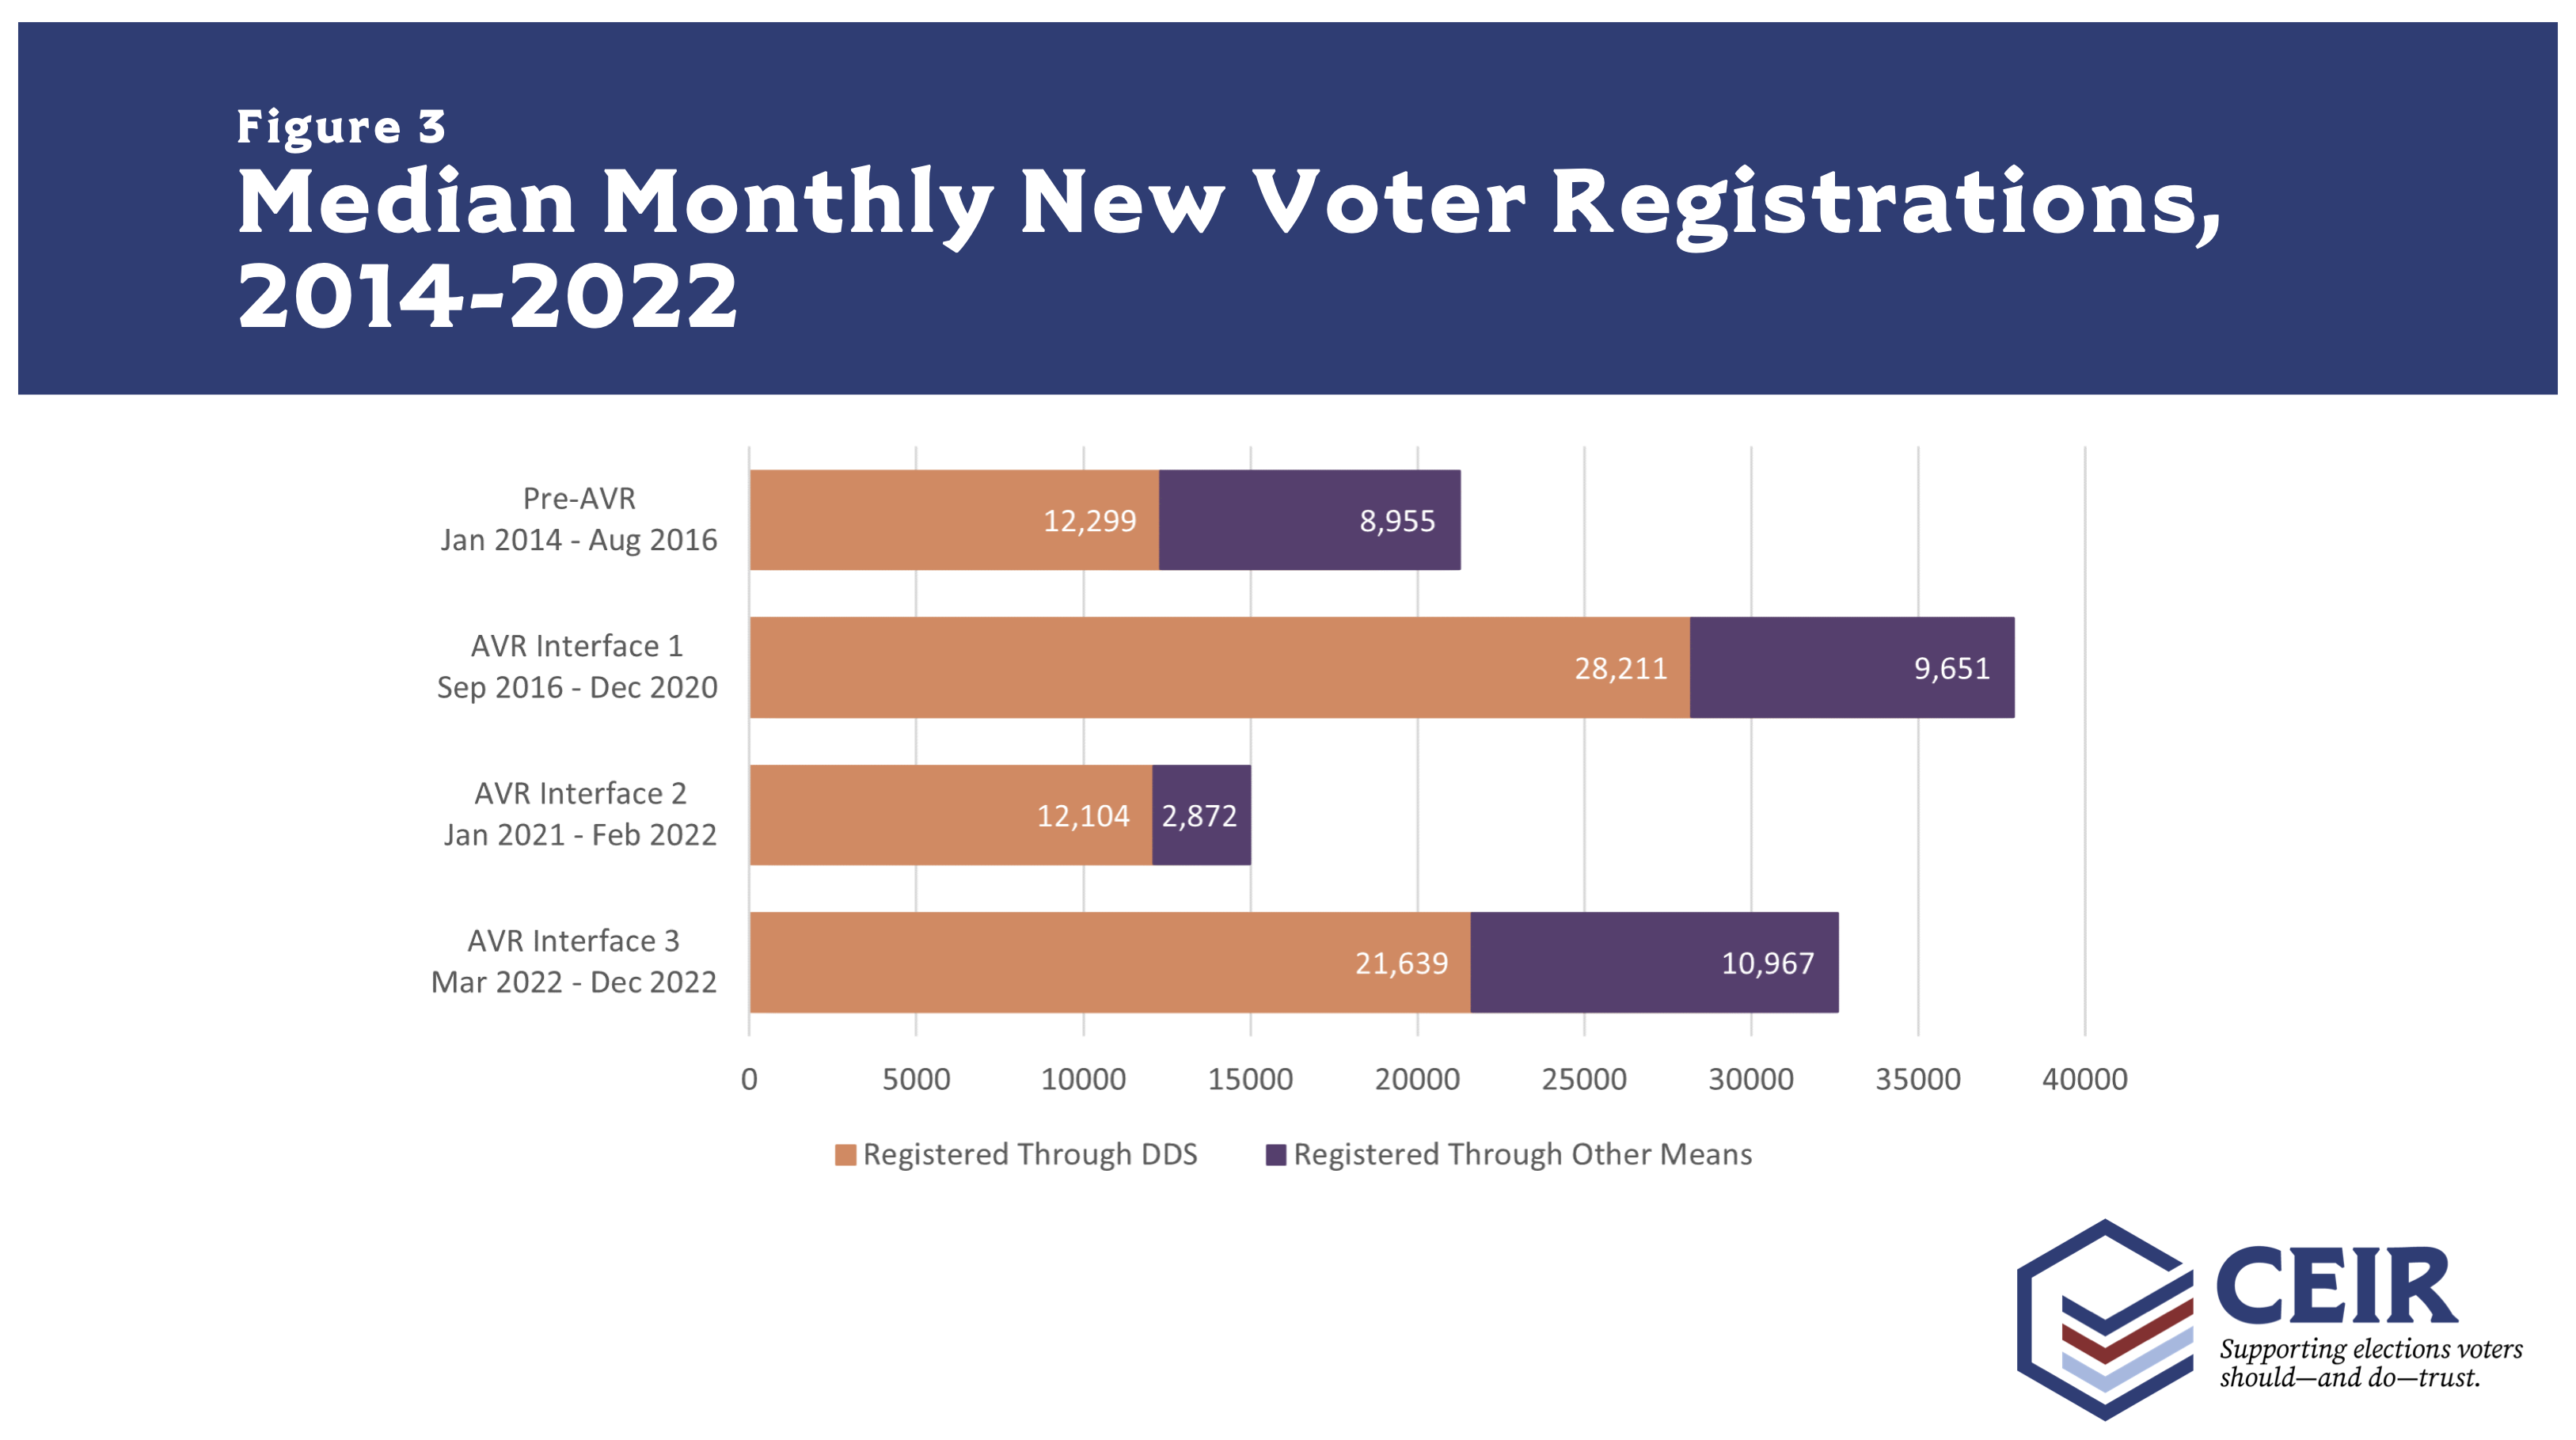
- In the first four years after AVR’s implementation, the active voter registration rate increased by 20 percentage points to 98% of eligible Georgians in 2020, up from 78% in 2016 (Figure 1). This increase was likely driven by a jump in new voters registering through DDS (Figure 3).
- As the registration rate increased, the registered population became more representative of the state’s population in terms of age and gender (Figures 4 and 5). Furthermore, while inactive records made up an average of 14% of the voter list in the 16 years before the implementation of AVR, the inactivity rate dropped to just 5% four years after its implementation (Figure 6).
- Since the implementation of AVR, DDS has become a major source of voter registrations in Georgia. The majority of new voter registrations are through DDS transactions (Figure 3), and DDS registration transactions consistently account for more registration transactions than non-DDS sources (Figures 7, 8, and 9).
Recent AVR trends, including an increase in the inactivity rate and a decrease in DDS registration transactions, may be temporary effects due at least in part to the COVID-19 public health emergency and associated policy changes, as well as AVR interface changes made in 2021 and 2022.

